Sensors Low Limb — FesRobex System Overview
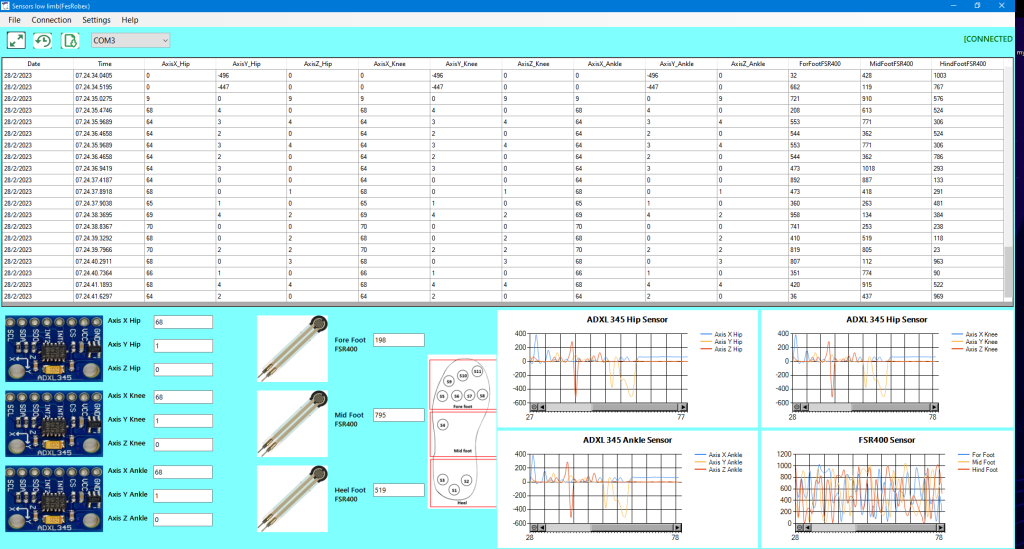
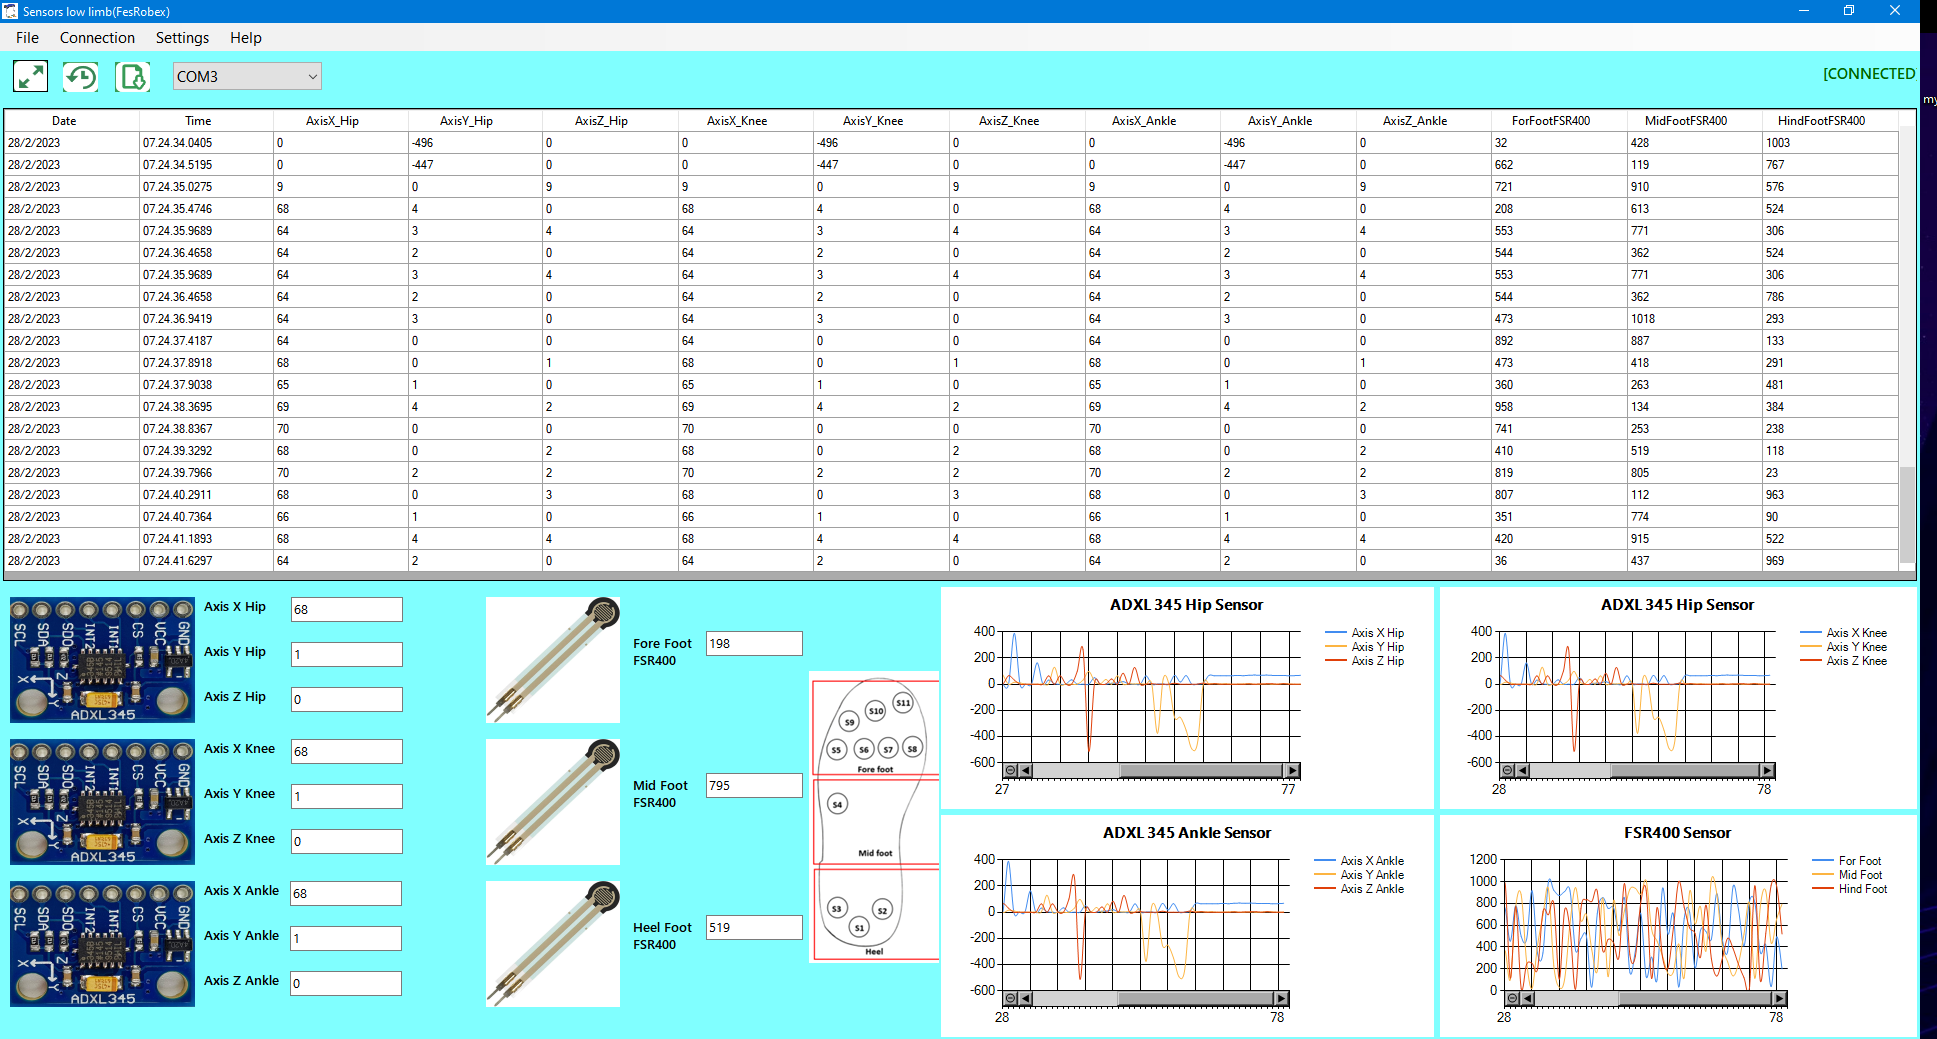
The screenshot shows the Sensors Low Limb (FesRobex) desktop application, a real-time data acquisition and monitoring interface designed for capturing biomechanical sensor data from the lower limb during gait analysis. The application communicates with sensor hardware via a serial connection (COM3) and displays live readings in both tabular and graphical formats.
System Architecture
The sensor array consists of two types of sensors strategically placed across three lower limb joints (hip, knee, and ankle) and three plantar pressure zones:
Accelerometers — ADXL345 (×3) Three ADXL345 triple-axis digital accelerometers are mounted at the hip, knee, and ankle joints, measuring acceleration along the X, Y, and Z axes. At the time of capture, the readings show Hip (X:68, Y:1, Z:0), Knee (X:68, Y:1, Z:0), and Ankle (X:68, Y:1, Z:0). The ADXL345 is a small, thin, ultralow-power 3-axis accelerometer with high resolution (13-bit) measurement up to ±16g, communicating over SPI or I2C interfaces.
Force Sensitive Resistors — FSR400 (×3) Three FSR400 pressure sensors are positioned on the foot sole at the forefoot (198), midfoot (795), and heel (519) regions. These sensors measure plantar pressure distribution during the gait cycle, providing critical data for foot strike pattern analysis and weight transfer assessment.
Data Acquisition
The data table logs timestamped readings at approximately 250ms intervals (as observed from the timestamps on 28/2/2023, starting at 07:24:34). Each record captures 12 data channels: three axes for each of the three accelerometers plus three FSR pressure values, totaling over 10,000 data points per minute of recording.
Real-Time Visualization
The interface includes four waveform charts displaying time-series data from the ADXL345 Hip, Knee, and Ankle sensors (with X, Y, Z axes color-coded), and a combined FSR400 chart showing forefoot, midfoot, and hindfoot pressure signals. The periodic waveform patterns visible in the accelerometer charts are consistent with cyclical gait motion, while the FSR chart captures the sequential heel-strike to toe-off pressure transfer characteristic of normal walking gait.
Application Features
The application provides serial port connectivity management, real-time data streaming and logging to a structured table format, graphical sensor placement diagrams showing the physical location of FSR sensors on the foot sole, and the ability to export data for further analysis. The interface is built as a Windows desktop application, likely developed in C# (WinForms) or LabVIEW, supporting COM port communication for Arduino or similar microcontroller-based data acquisition hardware.